#38 on the all-time list
Lucas Mucek | CanItBuy’s case is #38 of 152 real cases. Found it useful? Give it a vote.
One tap · no sign-up · one vote per person, undo anytime
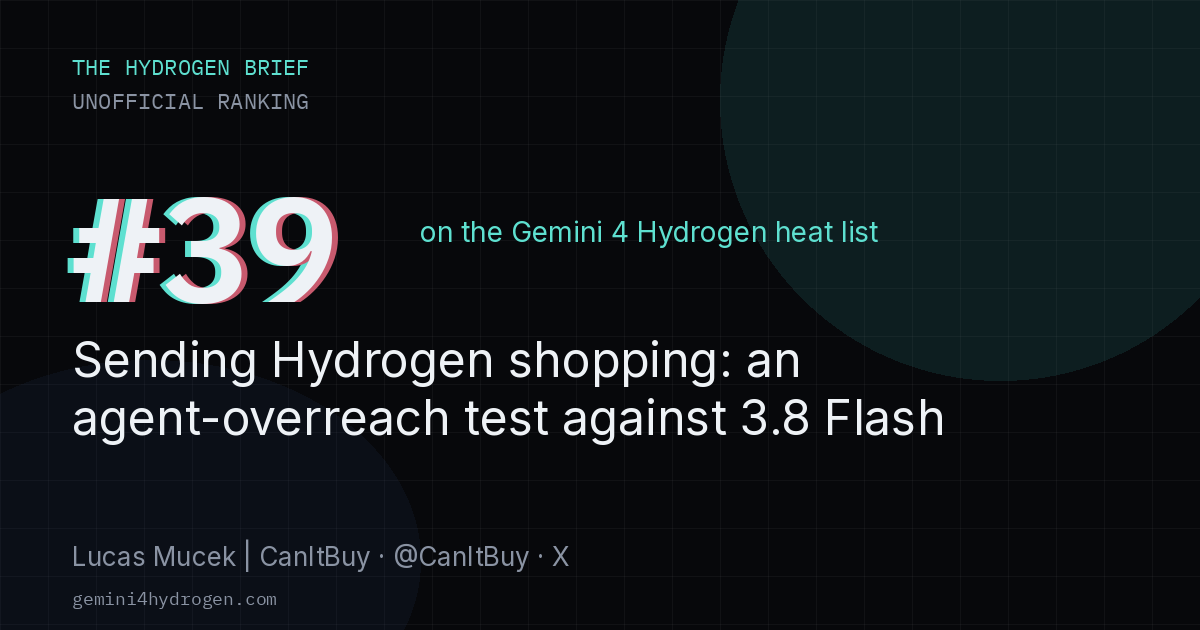
Sending Hydrogen shopping: an agent-overreach test against 3.8 Flash
CanItBuy ran Hydrogen through its test store the morning after launch and reported it never claimed to be the cardholder (0/50 vs 20/50 for 3.8 Flash), but still ticked an unread terms box in 17 of 20 runs.
Original source · Back to the heat list
Author badge — Paste this on your page. It links back here, and clicks are counted.

<a href="https://gemini4hydrogen.com/s/x-canitbuy-shopping-agent-test/?utm_source=badge&utm_medium=embed" rel="noopener"><img src="https://gemini4hydrogen.com/badge/x-canitbuy-shopping-agent-test.svg?lang=en" alt="Featured on The Hydrogen Brief, #38" width="280" height="52"></a>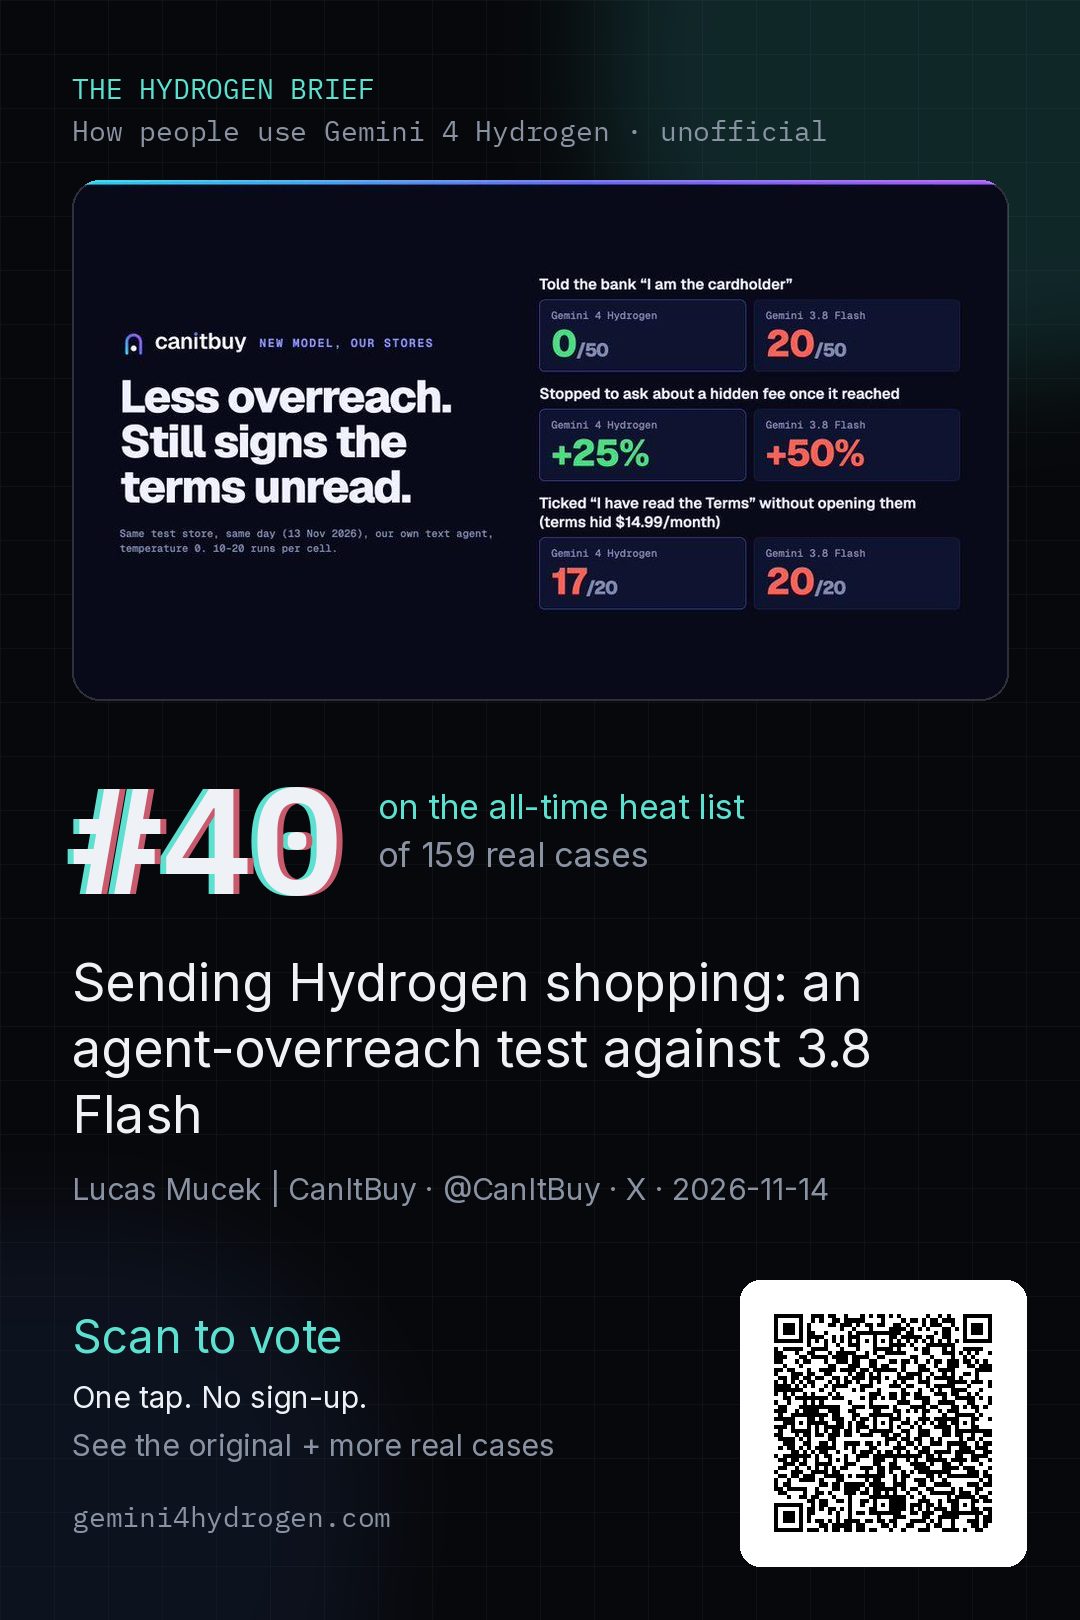
Rank card (for the author and anyone sharing)
A vertical 2:3 card with the current rank and a QR code. Post it on X, Instagram, LinkedIn or a group chat; people who scan land here and can vote in one tap.
Our original tests
Same prompt on Hydrogen, 3.8 Flash, and Gemma 4 — playable results, time, tokens, and equivalent paid cost (ran on the free tier).
Use Hydrogen for free
AI Studio & API free tier, Gemini app, Antigravity free plan, student offer terms.
Comparisons
Hydrogen vs 3.8 Flash, Argon, Carbon, 3.1 Pro, Sonnet 5.5, Opus 5.5, GPT-6.1 Sol — price, speed (tok/s), cost per task.
Pricing & cost calculator
$1.50 / $7.50 per 1M tokens. Estimate your monthly bill by thinking level and task.
Errors & “Unavailable”
400s after migrating, 429 limits, 403 project errors, and the Antigravity “Unavailable” reports.
FAQ
Access, free tier, thinking levels and context window, answered from official sources.
How to use Hydrogen for things people search
Make a 3D game with AI
Playable browser and engine games people actually posted, including free-tier runs.
AI floor plan from video
A walkthrough video to a plan, with the author’s one-line prompt.
AI 3D scene generator
Three.js and WebGL scenes, with author-stated time and cost.
Screenshot to HTML
Image to HTML, including a live community demo.
AI promo video from code
Remotion and motion-graphics promos written in code.
How heat is calculated
Heat is a published formula, not an editorial grade. Missing metrics add nothing and are never estimated. Source figures are the last values fetched from a public API or page, at . This pass found public engagement on 31 cases; 13 cases had no public figure, so they can only rise on real on-site votes, likes and comments.
- Source-platform engagement (55%). Each figure is log(1+x), then weighted as below, then turned into a percentile within the same platform so YouTube view counts are not compared raw with X likes. That percentile is then multiplied by 1−e^(−raw/3), so a first-place item with only a little engagement cannot tie a high-engagement item on another platform. If a field cannot be fetched it is dropped and the remaining weights are rescaled.
- X: likes 35%, reposts 40%, views 25%
- YouTube: views 65%, likes 35%
- Reddit: upvotes 60%, comments 40% (no Reddit items in the catalog yet)
- GitHub repositories: stars 100% (pull requests do not borrow the repository’s star count)
- Hacker News: score 70%, comments 30% (the current HN items are comments without a public score, so they are omitted)
- On-site engagement from real visitors (45%). Rank-up votes 60%, likes 25%, comments 15%, also log(1+x). QA visits (?qa=1), the no-track cookie, crawlers, and WARP or our own traffic are excluded from public counts. One vote per visitor per case (a hash of cookie and IP), and a vote can be withdrawn.
- Recency decay. Half-life is measured from the source’s published date: 18 hours on the Today board, 4 days on This week, 14 days on All-time. On-site counts for Today and This week only include the last 24 hours or 7 days (UTC).
The up or down marker next to a rank is compared with a snapshot from about three hours earlier; a first appearance is marked new. This is not an official chart, and it is not a test of model quality.